- BMI is a screening tool, not a diagnosis. It uses weight and height to estimate body fat — quick, free, and used by doctors worldwide.
- Adult BMI categories follow WHO standards. Underweight (<18.5), Normal (18.5–24.9), Overweight (25–29.9), Obese (30+) with specific health implications.
- BMI has real limitations. It cannot distinguish muscle from fat, ignores body distribution, and varies by age, sex, and ethnicity.
- BMR and TDEE tell you more. Your Basal Metabolic Rate and Total Daily Energy Expenditure explain how many calories your body actually needs.
- Waist circumference may matter more. Research shows waist-to-height ratio predicts heart disease risk better than BMI alone.
- For athletes, BMI is misleading. Muscle is denser than fat — a muscular person can be “overweight” by BMI while having low body fat.
- Children need different charts. BMI for kids uses age-and-sex-specific percentiles, not adult categories.
- Track trends, not single readings. Monthly BMI checks over 3–6 months show meaningful progress better than daily fluctuations.
What is BMI and why it matters
A single number that tells you whether your weight is in a healthy range — and why doctors still rely on it after nearly 200 years.
Body Mass Index (BMI) is a numerical value calculated from your weight and height. It was developed by Belgian mathematician Adolphe Quetelet in the 1830s, originally called the Quetelet Index, and was designed to describe the average build of populations. Despite its age, BMI remains the most widely used weight classification system in the world.
The World Health Organization (WHO) and the Centers for Disease Control (CDC) both use BMI as a key metric in public health reporting. Doctors, insurance companies, and health organizations worldwide use it as a first-line screening tool. It is simple to calculate, requires no special equipment, and gives a quick snapshot of whether a person is underweight, normal weight, overweight, or obese.
However, BMI is frequently misunderstood. It is not a direct measure of body fat. It is a ratio of weight to height that correlates reasonably well with body fat in population studies. For any single person, BMI can be misleading — especially if you are very muscular, very short, very tall, elderly, or from certain ethnic backgrounds. Use BMI as a starting point for conversation, not a final verdict.
Universal screening
Used by doctors, insurance companies, and health organizations worldwide as a first-line health assessment.
Simple and free
Anyone can calculate BMI with just a scale and a tape measure. No expensive body composition scans required.
Predictive insights
Research consistently shows BMI correlates with health risks including diabetes, heart disease, and certain cancers.
How BMI is calculated
A simple mathematical relationship between your weight and height — and why height is squared.
BMI uses a simple formula — the standard BMI formula — that relates your weight to your height. The formula is the same worldwide, but the units depend on whether you measure in metric or imperial.
Metric formula
BMI = weight (kg) ÷ height (m)²
Example: A person weighs 70 kg and is 1.75 m tall.
BMI = 70 ÷ (1.75 × 1.75) = 70 ÷ 3.0625 = 22.9 (normal weight)
Imperial formula
BMI = 703 × weight (lbs) ÷ height (in)²
Example: A person weighs 154 lbs and is 69 inches tall (5’9”).
BMI = 703 × 154 ÷ (69 × 69) = 108,262 ÷ 4,761 = 22.7 (normal weight)
Why height is squared
Quetelet discovered that weight scales with the square of height, not the cube (which would be true for perfect geometric scaling). Humans are not perfectly proportional — taller people tend to be leaner relative to their height. The square of height was empirically found to give the best correlation with body fat across populations.
Common calculation mistakes
- Wrong: Using height in cm instead of m (175 instead of 1.75)
- Wrong: Forgetting to square the height
- Wrong: Mixing metric weight with imperial height
- Wrong: Using feet instead of inches (5’9” = 69 inches, not 5.9)
BMI categories explained
The WHO and CDC use the same standard categories for adults — this BMI chart shows what each means for your health.
| Category | BMI Range | Health Implication |
|---|---|---|
| Underweight | Below 18.5 | May indicate malnutrition, eating disorders, or chronic illness. Risks include weakened immunity, osteoporosis, and fertility issues. |
| Normal weight | 18.5 – 24.9 | Healthy range associated with lowest risk of weight-related diseases. Not a guarantee of good health — combine with other metrics. |
| Overweight | 25.0 – 29.9 | Moderate health risks including type 2 diabetes, high blood pressure, and heart disease. Athletes with high muscle mass often fall here. |
| Obese Class I | 30.0 – 34.9 | Significantly elevated health risks. Weight loss of 5–10% can significantly reduce risks. |
| Obese Class II | 35.0 – 39.9 | High risk of serious complications. Medical intervention often recommended. |
| Obese Class III | 40.0+ | Severe or morbid obesity. Highest health risks and significantly reduced life expectancy. |
These categories are based on European and North American populations. For Asian populations, the WHO recommends lower cutoffs: overweight at BMI 23+ and obesity at BMI 25+. For Pacific Islander and some African populations, higher cutoffs may be appropriate. BMI is also not accurate for pregnant women or adults over 65 (where slightly higher BMI may be protective).
Beyond basic BMI: Prime and Oxford
Standard BMI is just the beginning. BMI Prime and Oxford BMI provide additional context for your score.
BMI Prime
Formula: BMI Prime = your BMI ÷ 25
It shows how far you are from the upper normal limit. Below 0.75 = significantly underweight. 1.0 = normal upper limit. Above 1.2 = significantly overweight. BMI Prime is useful for comparing people of different heights.
Oxford BMI
Formula: Oxford BMI = 1.3 × weight (kg) ÷ height (m)².5
Uses a height exponent of 2.5 instead of 2, making it more accurate for people above 180 cm or below 155 cm. If your Standard and Oxford BMI differ by more than 1 point, the Oxford figure is likely more accurate for your body type.
Understanding BMR and TDEE
How many calories your body actually needs — and why BMI alone does not tell the full story.
Basal Metabolic Rate (BMR) is the number of calories your body burns at rest just to stay alive — breathing, circulation, cell production. Total Daily Energy Expenditure (TDEE) is BMR multiplied by your activity level, representing the total calories you burn in a day.
Calculate BMR (Mifflin-St Jeor equation)
Men: BMR = 10 × weight (kg) + 6.25 × height (cm) − 5 × age + 5
Women: BMR = 10 × weight (kg) + 6.25 × height (cm) − 5 × age − 161
This is the most reliable equation for estimating resting metabolic rate, predicting RMR within 10% of measured values in most individuals.
Multiply by activity level to get TDEE
- Sedentary (office job, little exercise): BMR × 1.2
- Lightly active (1–3 days/week): BMR × 1.375
- Moderately active (3–5 days/week): BMR × 1.55
- Very active (6–7 days/week): BMR × 1.725
- Elite athlete (daily training + physical job): BMR × 1.9
TDEE is your maintenance calorie level. To lose weight, eat 300–500 calories below TDEE. To gain, eat 300–500 above. The AFFLIGO BMI Calculator computes both BMR and TDEE automatically based on your inputs.
BMI and metabolism are linked. Higher BMI often means higher BMR because larger bodies burn more calories at rest. But the relationship is not linear — two people with the same BMI can have very different metabolic rates depending on muscle mass, age, and genetics. That is why BMR and TDEE give you a more personalised picture than BMI alone.
Estimating body fat percentage
BMI can estimate body fat — but it is an approximation, not a measurement.
The Deurenberg formula estimates body fat percentage from BMI, age, and sex:
Body Fat % = 1.20 × BMI + 0.23 × age − 10.8 × sex − 5.4 (sex: male = 1, female = 0)
This formula is comparable in accuracy to skinfold calipers (standard error of about 4%) but less accurate than DEXA scans or hydrostatic weighing. Results are clamped to a range of 3% to 60%. Body fat increases naturally with age at the same BMI, which is why age is a variable in the equation.
Healthy body fat ranges: Men 10–20%, Women 20–30%. Athletes may be significantly lower. The AFFLIGO calculator estimates your body fat % and lean body mass automatically.
Finding your healthy weight range
The weight range where your BMI falls between 18.5 and 24.9 — and what to do if you are outside it.
Calculate your range
Minimum healthy weight = 18.5 × height (m)²
Maximum healthy weight = 24.9 × height (m)²
Example: For someone 1.75 m tall: min = 18.5 × 3.0625 = 56.7 kg, max = 24.9 × 3.0625 = 76.3 kg.
Understand the advice
If you are underweight, the tool shows how many kg to gain. If overweight, how many kg to lose. If normal, it confirms you are within the healthy range. Use this as a practical target, not a strict rule.
How to use the BMI calculator
Enter five inputs — gender, age, height, weight, activity — then read nine metrics below.
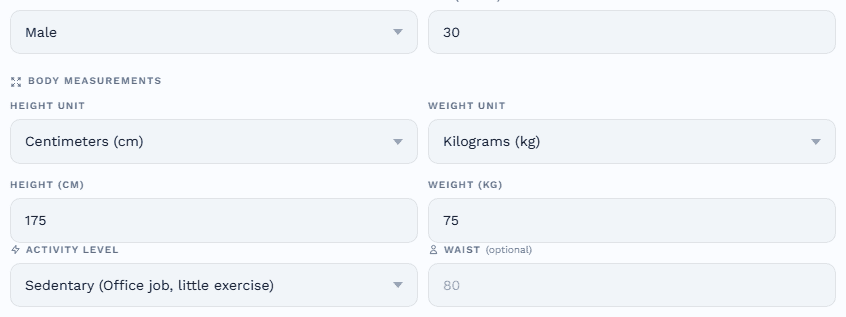
Enter your details
Set gender (male or female — BMR formulas differ), age (for BMR), height unit (cm or ft/in), weight unit (kg or lb), and activity level (for TDEE). Optionally enter your waist circumference (in cm) for Waist-to-Height Ratio analysis. Stand barefoot against a wall for the most accurate height measurement.
Click Calculate
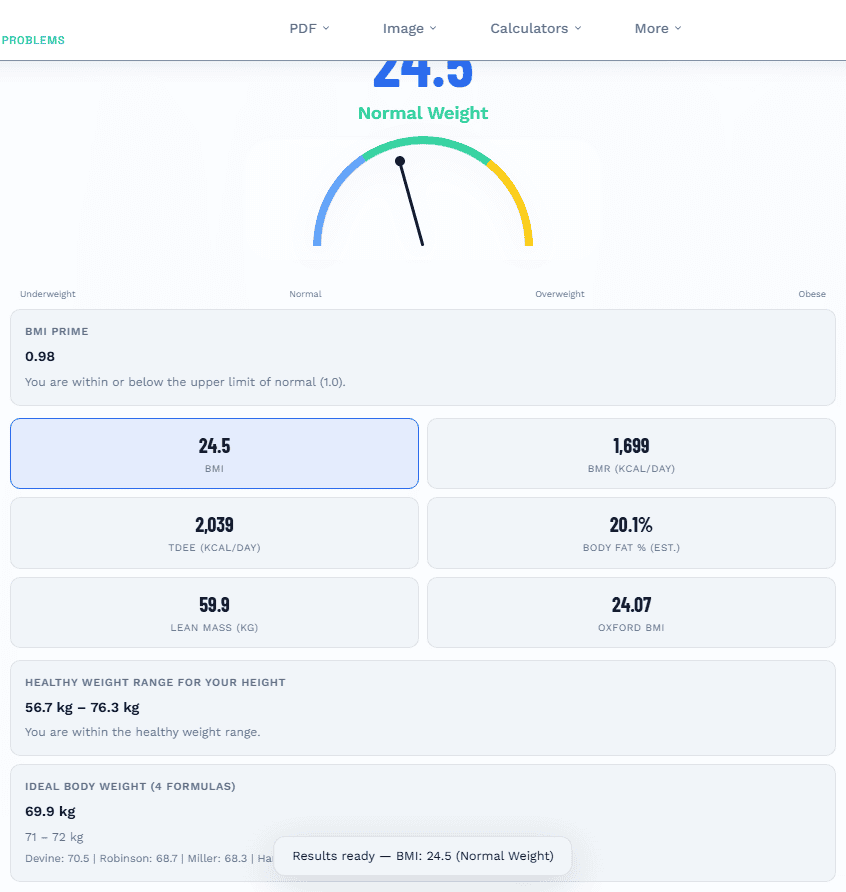
All computations happen instantly in your browser. The tool switches to the Results tab showing a colour-coded gauge with a rotating needle: blue for underweight, green for normal, yellow for overweight, and red for obese.

Read your results
Nine metrics appear: Standard BMI, Oxford BMI, BMI Prime, BMR (calories/day at rest), TDEE (total daily calorie need), Body Fat % (estimated), Lean Mass (kg), Ideal Body Weight (average of 4 formulas), and if waist was entered: Waist-to-Height Ratio and Weight Loss Pace (time to reach healthy BMI at 3 deficit levels).
Save and track
Every calculation is automatically saved to your browser's history. Use Copy to paste results into a notes app or share with your doctor. Use Print to generate a formatted PDF report. Export your full history as a CSV file for spreadsheet analysis. Morning weigh-ins on a hard floor give the most consistent month-to-month trend.

Understanding your results
Each metric tells a different part of the story — here is how to read them together.
Standard BMI
The classic weight/height² formula. Compared against WHO categories. This is the number most people recognise.
Oxford BMI
A refined formula more accurate for people above 180 cm or below 155 cm. If it differs from Standard BMI by more than 1 point, trust this one.
BMI Prime
Your BMI divided by 25. Below 0.75 = significantly underweight. 1.0 = normal upper limit. Above 1.2 = significantly overweight.
BMR (kcal/day)
Calories your body burns at rest. Uses the Mifflin-St Jeor equation. This is not how much you should eat — it is your baseline.
TDEE (kcal/day)
BMR × activity multiplier. Your total daily calorie burn. Use this to set calorie targets for weight loss, maintenance, or gain.
Body Fat % (est.)
Estimated from BMI, age, and sex using the Deurenberg formula. Comparable to skinfold calipers. Less accurate than DEXA.
Before publishing I cross-checked the calculator with three manual cases: 70 kg at 175 cm gives exactly 22.9 (healthy), 95 kg at 178 cm gives 30.0 (the Obese Class I boundary), and the Oxford variant for a 190 cm input came out about a point lower than Standard BMI, as the height correction predicts. The print report carries all six metrics plus the category table, so a doctor sees the full picture, not just one number.
Saving and tracking over time
BMI is most valuable when tracked consistently — here is how to build a system that works.
Measure monthly, not daily
Daily weight fluctuations (1–2 kg) are caused by water, food, and salt — not actual fat changes. Monthly measurements smooth out noise and reveal true trends. Weigh yourself under the same conditions each time.
Track multiple metrics
BMI alone is just a snapshot. Track weight, waist circumference, BMI, resting heart rate, and body fat % together. The AFFLIGO calculator stores all these locally so you can compare past and current readings.
Set realistic goals
Aim for 0.5–1 kg weight loss per week. A 5% weight loss over 6 months is realistic and sustainable. Focus on habits, not numbers: eat more vegetables, walk 30 minutes daily, sleep 7–8 hours, reduce sugar.
BMI for children and teens
Children use a different BMI system based on age and sex percentiles — not adult categories.
For children and teens (ages 2–19), BMI is calculated the same way as adults, but the results are interpreted differently. Instead of fixed categories, BMI is compared to other children of the same age and sex using percentile charts developed by the CDC.
| Category | Percentile | Meaning |
|---|---|---|
| Underweight | Below 5th | May indicate inadequate nutrition or chronic illness. Consult a pediatrician. |
| Healthy weight | 5th to 85th | Target range for most children. Focus on healthy habits, not weight numbers. |
| Overweight | 85th to 95th | Risk of becoming obese. Lifestyle changes recommended. |
| Obese | 95th or above | Medical evaluation and intervention recommended. |
The AFFLIGO BMI Calculator is designed for adults (20+). For children, use the CDC’s Child and Teen BMI Calculator which plots results on growth charts. Never put a child on a restrictive diet without medical supervision.
BMI limitations you should know
BMI is useful but not perfect. Understanding its limitations prevents misinterpretation.
Does not distinguish muscle from fat
A bodybuilder with 8% body fat and a sedentary person with 30% body fat can have the same BMI. Muscle is denser than fat, pushing BMI higher for muscular individuals.
Ignores fat distribution
BMI treats all weight equally, but visceral fat (around organs) is far more dangerous than subcutaneous fat. A person with normal BMI but large waist may have higher risks.
Ethnic differences
Categories were developed from European populations. Asian populations face health risks at lower BMI values. Pacific Islanders may be healthy at higher BMI.
Not accurate for the elderly
For adults over 65, slightly higher BMI (25–27) may be protective. Older adults naturally lose muscle mass, and some extra weight provides reserves during illness.
Not for pregnant women
Pregnancy naturally increases weight. BMI does not account for the fetus, placenta, or increased blood volume. Doctors track weight gain against pregnancy-specific guidelines.
Same categories for both sexes
Women naturally have higher body fat than men at the same BMI. A BMI of 24 in a woman typically means more body fat than the same BMI in a man.
Alternatives to BMI
When BMI is not enough, these metrics provide a more complete picture of body composition and health.
| Method | How to Measure | Risk Threshold |
|---|---|---|
| Waist circumference | Measure around waist at belly button level | Men: over 102 cm (40 in). Women: over 88 cm (35 in). |
| Waist-to-hip ratio | Divide waist by hip circumference | Men: over 0.90. Women: over 0.85. |
| Waist-to-height ratio | Divide waist by height | Over 0.5 = increased risk. Keep waist less than half your height. |
| Body fat percentage | DEXA, calipers, or bioelectrical impedance | Men: over 25%. Women: over 33%. |
| Body Roundness Index (BRI) | Uses waist circumference and height | Emerging metric. Reference ranges still being established. |
The American Medical Association recommends using multiple metrics including waist circumference, body composition, and metabolic markers — not BMI alone — to assess obesity and health risk.
BMI and health risks
Decades of research show clear correlations between BMI and specific health conditions.
Type 2 diabetes
BMI over 30 increases risk by 3–5 times. BMI over 35 increases risk by 7–12 times. Weight loss of 5–10% can reduce diabetes risk by 50% in high-risk individuals.
Cardiovascular disease
For every 5-point BMI increase above 25, heart disease risk increases by about 30%. However, fitness level matters more than BMI alone — exercise independently reduces risk.
Sleep apnea
BMI over 30 increases sleep apnea risk by 4–10 times. Excess weight around the neck narrows the airway. Weight loss of 10–15% can significantly reduce symptoms.
Certain cancers
Higher BMI is linked to increased risk of 13 types of cancer including esophageal, colorectal, breast, uterine, kidney, and thyroid. Mechanisms include chronic inflammation and insulin resistance.
BMI for athletes and muscular people
If you lift weights, play sports, or have above-average muscle mass, BMI may misclassify you.
A muscular athlete with 12% body fat and a sedentary person with 30% body fat can have the same BMI. This does not mean BMI is useless for athletes — it means you need additional metrics.
Better metrics for athletes
Use body fat percentage (DEXA or calipers), waist circumference (under 94 cm men, under 80 cm women), performance metrics (VO2 max, strength), and health markers (blood pressure, cholesterol) instead of relying on BMI alone.
When BMI is still useful
Even for athletes, BMI tracks changes over time. If BMI increases while body fat stays the same, you are gaining muscle. If both increase, you are gaining fat. Use BMI as one data point in a dashboard.
The “fat but fit” reality
Research shows cardiovascular fitness is more important than BMI for mortality risk. A fit person with obesity has lower risk than an unfit person with normal weight. The best strategy: pursue both healthy weight AND physical activity.
How to lower BMI safely
Sustainable weight loss comes from habits, not crash diets — here is the evidence-based approach.
Create a modest calorie deficit
Eat 300–500 calories below your TDEE per day. This produces 0.5–1 kg weight loss per week — sustainable and healthy. Severe restriction slows metabolism and leads to rebound weight gain.
Eat more protein and vegetables
Protein preserves muscle during weight loss and keeps you full longer. Vegetables provide volume and nutrients with few calories. Aim for protein at every meal and half your plate as vegetables.
Exercise regularly
Combine cardio (walking, cycling, swimming) with strength training. Cardio burns calories; strength training preserves muscle mass. Even 30 minutes of walking daily makes a significant difference.
Sleep and stress management
Poor sleep increases hunger hormones and cravings. Aim for 7–8 hours. Chronic stress raises cortisol, which promotes abdominal fat storage. Prioritize sleep and stress reduction alongside diet and exercise.
Crash diets that lose 5 kg in a week are mostly water loss and are not sustainable. They often lead to rebound weight gain and can cause nutrient deficiencies. Focus on gradual, permanent habit changes instead.
Medical disclaimer
This guide is for informational and educational purposes only. It is not a substitute for professional medical advice, diagnosis, or treatment. BMI is a screening tool — not a diagnostic test. According to the WHO and CDC, BMI should be considered alongside waist circumference, body fat percentage, and blood markers. Always consult a qualified healthcare provider for personalized health assessments.
Frequently asked questions
The most common questions about BMI, answered from evidence and experience.
For adults 20–64, the healthy range is 18.5 to 24.9 regardless of age. For adults over 65, a slightly higher BMI (25–27) may be protective. For children, BMI is interpreted by age-and-sex percentiles, not fixed categories.
Yes. BMI can misclassify muscular individuals, ignores fat distribution, and does not account for ethnicity, age, or pregnancy. It is a screening tool, not a diagnostic test. Use it alongside waist circumference and body fat percentage.
Once per month is sufficient. Daily fluctuations from water, food, and salt cause unnecessary anxiety. Monthly measurements reveal true trends.
The formula and categories are identical for male and female adults. However, women naturally have higher body fat percentages than men at the same BMI. A BMI of 24 in a woman typically corresponds to more body fat than the same BMI in a man.
Population studies suggest the lowest mortality risk is at BMI 20–22. However, the ideal BMI varies by individual — athletes may be healthy at higher BMI with low body fat, and older adults may benefit from BMI 25–27.
Oxford BMI = 1.3 × weight (kg) ÷ height (m)².5. It uses a height exponent of 2.5 instead of 2, making it more accurate for people above 180 cm or below 155 cm tall.
A pound of muscle and a pound of fat weigh the same. However, muscle is denser and takes up less space. A muscular person can be lean but heavy, which pushes BMI higher — which is why BMI misclassifies athletes.
A BMI of 25 is the boundary between normal weight and overweight. It does not automatically mean you are unhealthy — factors like muscle mass, waist circumference, and blood markers matter. However, consistently rising above 25 may increase risk for heart disease and type 2 diabetes.
Use both. BMI is a quick screening tool based on weight and height. Body fat percentage tells you your actual fat-to-lean-mass ratio. A muscular person may have BMI 27 but only 15% body fat (healthy). BMI alone would misclassify them. Body fat measurement (via DEXA, calipers, or bioimpedance) gives a fuller picture.
Yes. The WHO Western Pacific Region suggests lower action points for Asian adults: overweight from BMI 23 (instead of 25) and obesity from BMI 27.5 (instead of 30), because health risks appear at lower values. Many clinics in India, China, and Japan use these cutoffs. Discuss the right range with your doctor.
BMI (Body Mass Index) is a single number calculated from your weight and height. It screens for four weight categories — underweight, normal weight, overweight, or obese — and estimates body-fat risk. It does not measure body fat directly, so use it as a starting point, not a diagnosis.
Metric: BMI = weight (kg) ÷ height (m)² — for example, 70 kg at 1.75 m gives 22.9. Imperial: BMI = 703 × weight (lbs) ÷ height (in)². Or skip the maths and use the free BMI calculator, which adds age, gender, BMR and body-fat estimates automatically.
For most adults, a healthy BMI is 18.5 to 24.9. Population studies suggest the lowest mortality risk sits around BMI 20–22. For Asian adults, overweight starts at 23 and obesity at 27.5. Athletes and adults over 65 may be healthy outside this range.
Key Takeaways
- BMI is a screening tool, not a diagnosis. It uses weight and height to estimate body fat risk — quick, free, and universally used, but has real limitations.
- Adult categories follow WHO standards: Underweight (<18.5), Normal (18.5–24.9), Overweight (25–29.9), Obese (30+).
- BMI cannot distinguish muscle from fat. Athletes are often misclassified as overweight. Use body fat percentage alongside BMI.
- BMR and TDEE explain your calorie needs. BMR is calories burned at rest; TDEE includes activity level.
- Waist circumference may be more important than BMI. Visceral fat is a stronger predictor of heart disease.
- Ideal Body Weight uses 4 formulas (Devine, Robinson, Miller, Hamwi). Use as a reference, not a prescription.
- Weight loss pace is estimated from your calorie deficit. A moderate deficit (750 kcal/day) loses ~0.75 kg/week.
- Track trends, not single readings. Monthly measurements over 3–6 months reveal meaningful progress.

Karan Kumar


